Online house price valuation

Online current house price estimation and price forecast using machine learning algorithms.

Dutch Real Estate analytics

Make a decision when to buy the house using the fundamental indicators and trends.
Calculations with visualization provide information for your situation.

Here you can find information about...

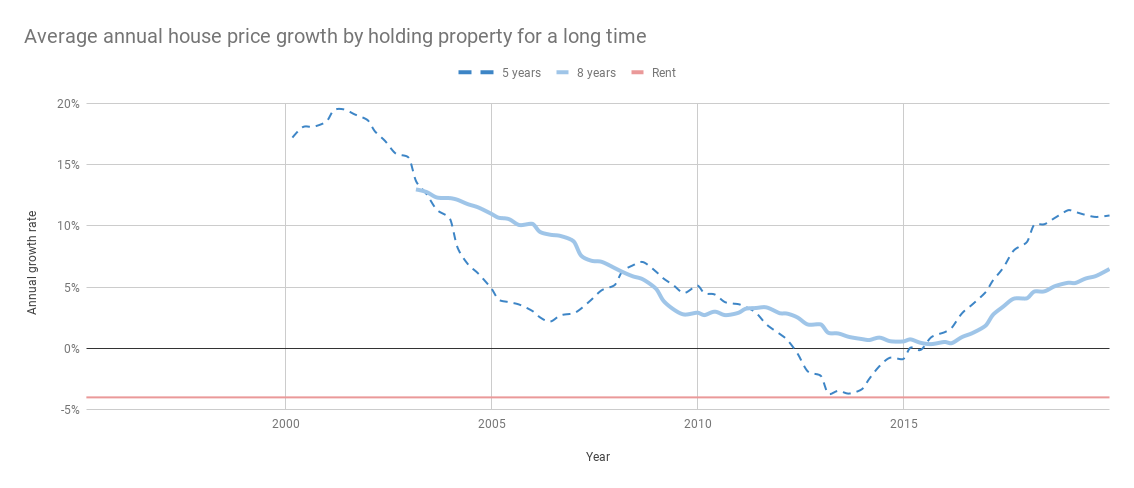
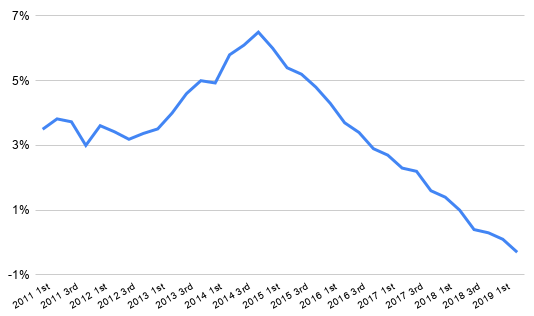
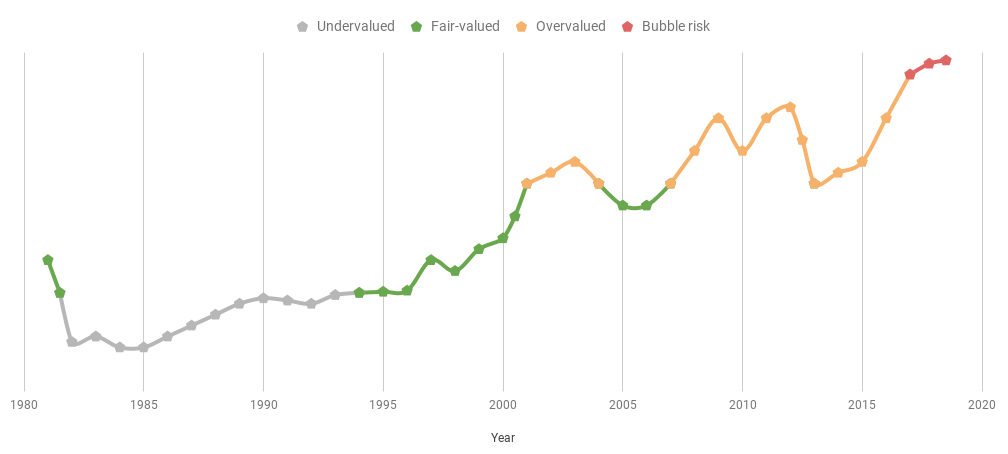
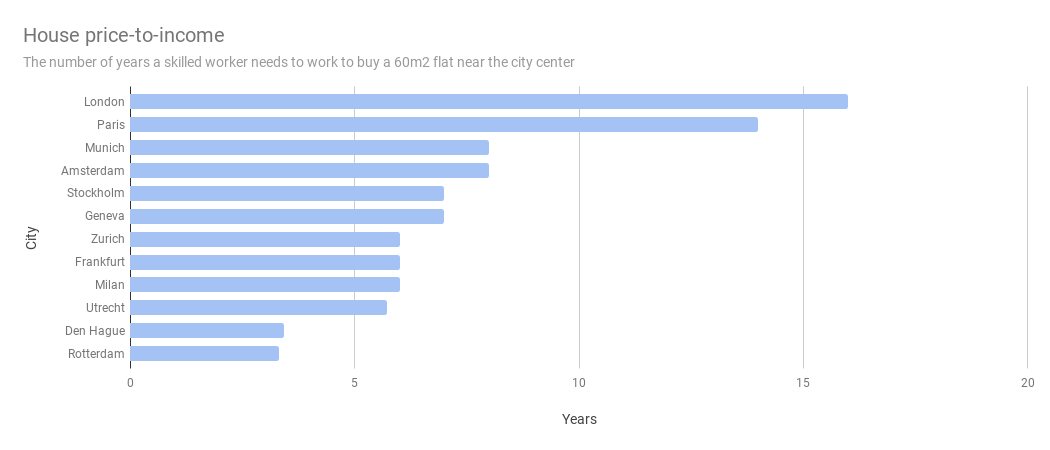
Is it good time to buy a house in the Netherlands.

How much money you can make on Airbnb.

Compare in details house rent vs owning a house in the Netherlands.

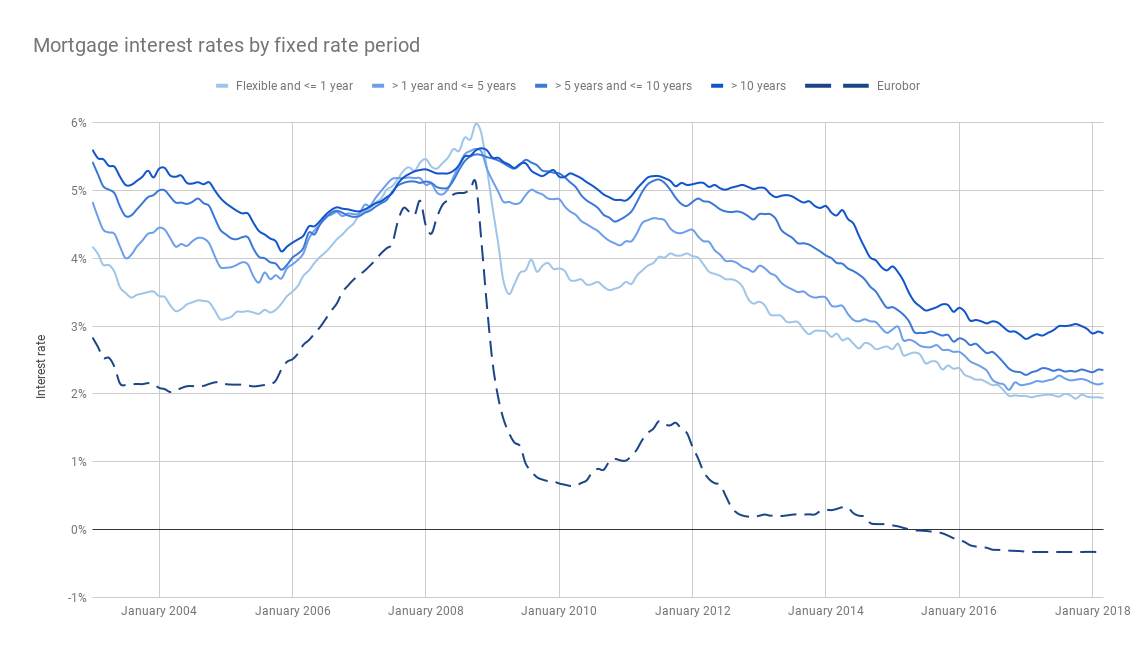
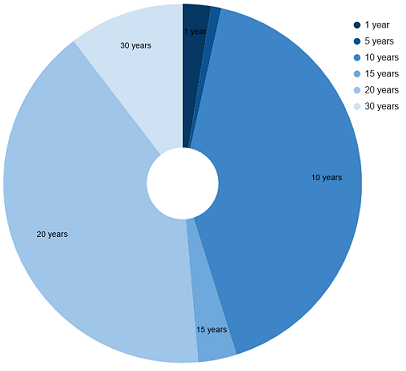
How to invest in property in the Netherlands. Mortgage requirements, taxation, restrictions, expected returns.

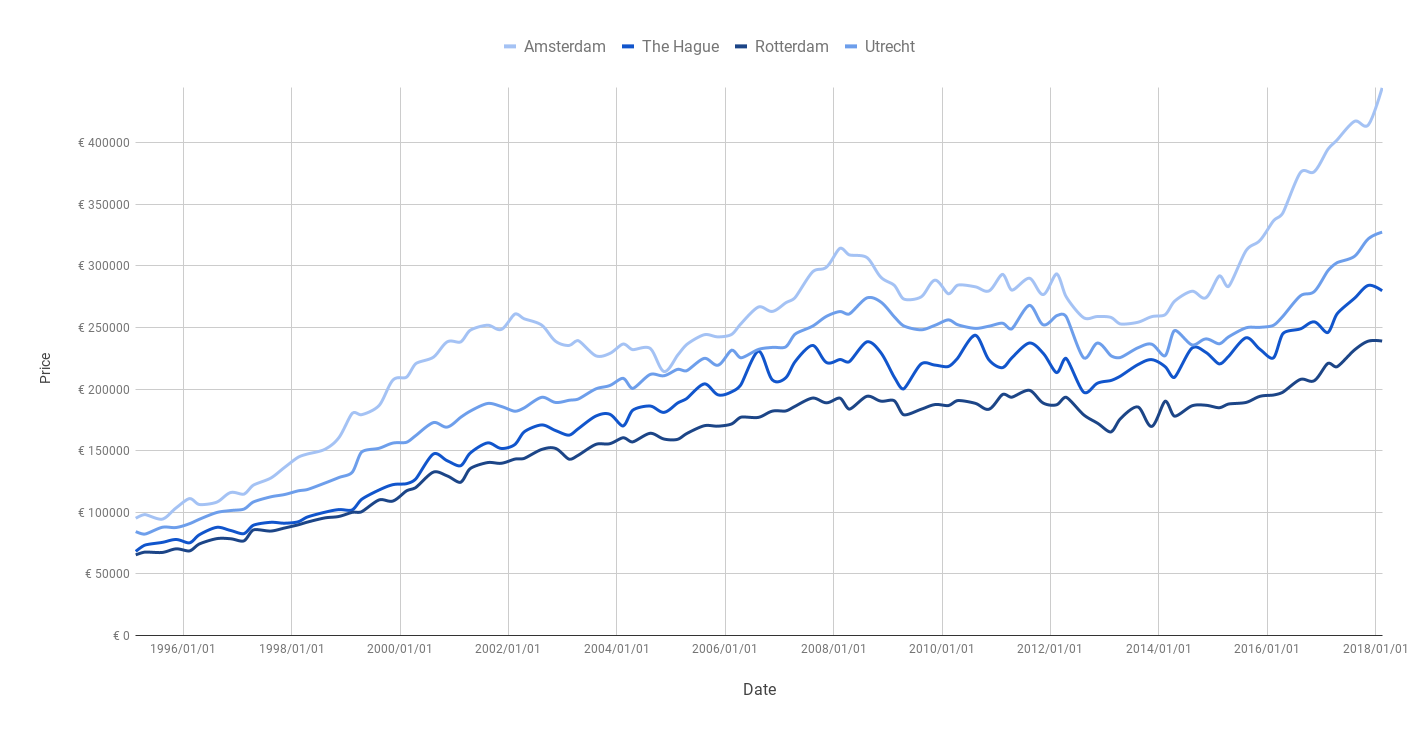
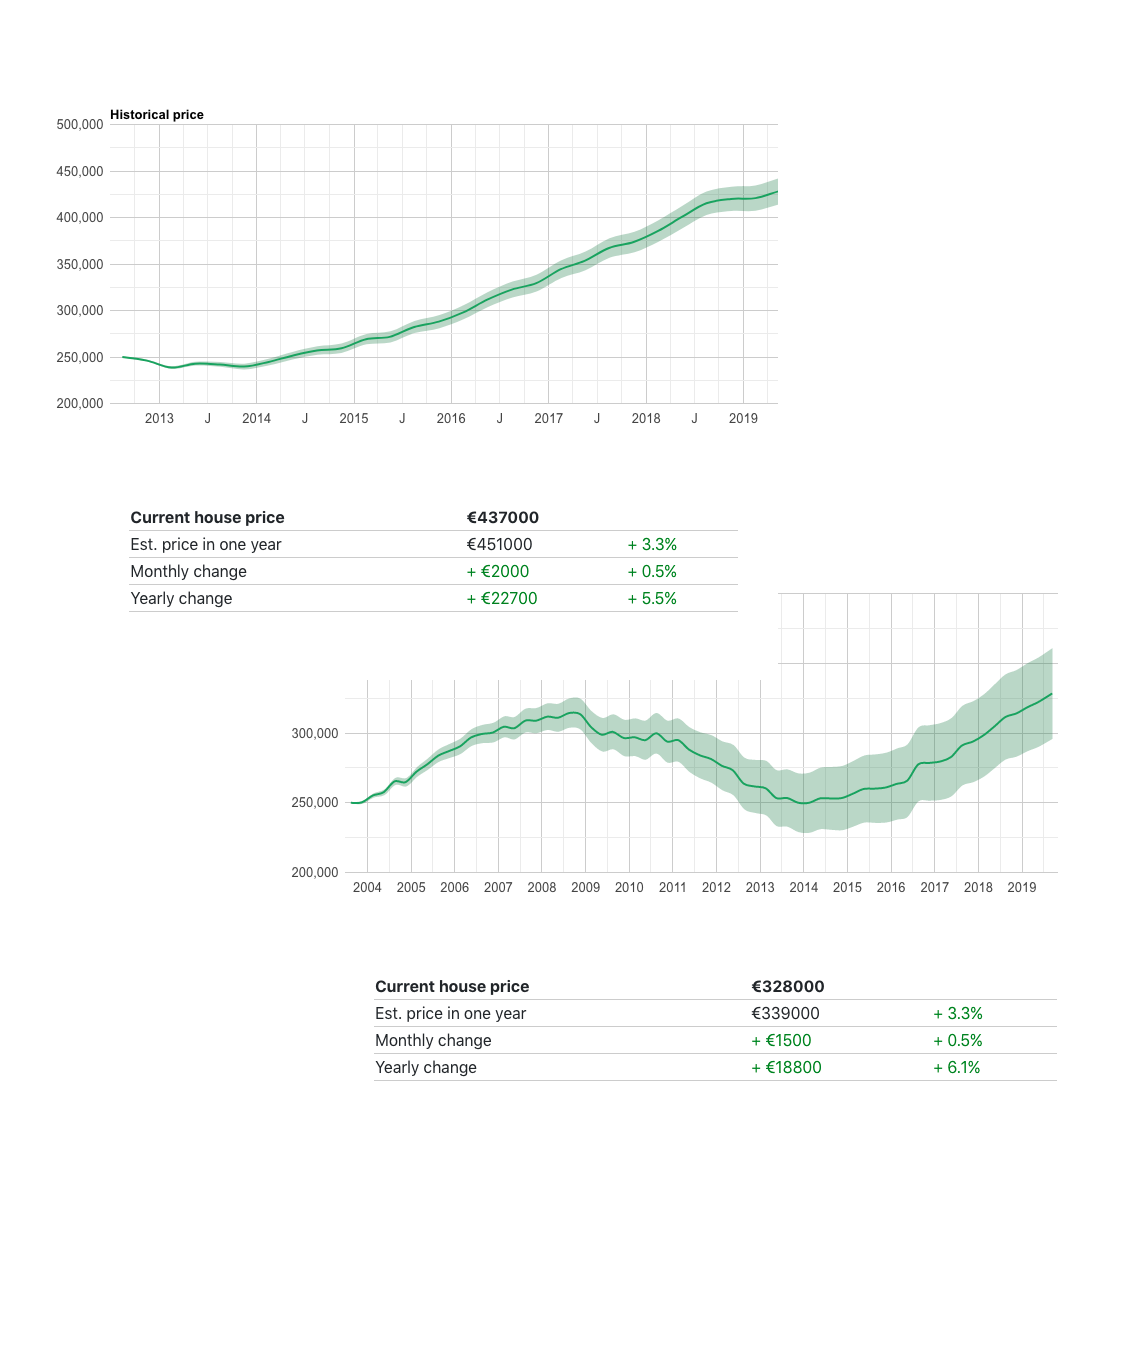
Calculate the current price of your house and get price forecast for next year.

House prices in Dutch cities

Chart below shows historical prices over last 20 years for four Dutch biggest cities including the forecast for coming years from major financial institutions.

house prices Amsterdam house prices Rotterdam house prices Hague house prices Utrecht
Amsterdam

Average annual price growth rate is 3.30%

Rotterdam

Average annual price growth rate is 2.69%

Den Hague

Average annual price growth rate is 2.68%

Utrecht

Average annual price growth rate is 4.17%


Prices move up and down, but in all the cities there is a positive price trend. That means that if you buy a house and keep it for many years, then its price will be higher then the bought price. But, how many years is needed to keep the house to be sure that it will have a positive balance? The chart below answers the question from historical perspective: 8 years holding always had the positive balance, or 5 years holding always had better balance compared to renting the relevant place.

Netherlands historical mortgage rates chart

Average house purchase prices

Average house dwelling prices hit the record in all the cities by overcoming the level reached before the economic crisis hit in 2008.

Average house purchase prices in Netherlands. Amsterdam, Utrecht, Rotterdam, The Hague.

Fundamental factors. Mortgage interest rate.

Historically, rising mortgage interest rates have served as the main trigger of price corrections. Many banks do lend money to provide mortgages. Euribor-rate reflects the interest rate that bank has to pay to land money from other banks on the market. Now, Euribor-rate is historically low which mean that it is good time to fix rate for longer period.

Netherlands historical mortgage rates chart

Fixed-rate periods and price bidding

Fixed-rate period in percentages.

Following chart provides information about how people fix mortgage interest rate period. Majority prefers to protected themselves against interest rate increases, but not benefit from interest rate decreases and always to know how much have to pay every month in future.

Fixed-rate period in percentages

Percentage difference between asking and purchase price.

Asking price is the amount the seller is asking for the home. Selling price is the amount at which the property actually sells. Following chart shows trend abd current difference in asking-selling price that helps to estimate expectations on the housing market.

Percentage difference between asking and purchase price

Amsterdam real estate bubble index

Price bubbles are a regularly recurring phenomenon in property markets. The term “bubble” refers to a substantial and sustained mispricing of an asset, the existence of which cannot be proved unless it bursts. But recurring patterns of property market excesses are observable in the historical data. Typical signs include a decoupling of prices from local incomes and rents, and distortions of the real economy, such as excessive lending and construction activity. The Real Estate Bubble Index gauges the risk of a property bubble on the basis of such patterns. The Index does not predict whether and when a correction will set in. A change in macroeconomic momentum, a shift in investor sentiment or a major supply increase could trigger a decline in house prices.

Netherlands house bubble price chart
Real-time calculations derived from it for the period 1980 to 2010 in major cities in the world estimated the likelihood of a crash after a bubble-risk warning signal within the subsequent 12 quarters at 50–60%. This compares to the probability of a real estate crash of about 12% in a given quarter during that time.

Compare to other cities

House price-to-income ratios are often used as a way to compare dwelling prices in different countries and cities, with the implication often being that if the ratio in one city is significantly above that in another, then that cities dwellings are potentially overvalued (or the other’s are undervalued). Bar chart illustrates relative position of Dutch cities comparing to other European ones.

Amsterdam, Rotterdam, Hague, Utrecht house price to income

If you need better control over personal finance, check out our partner CapitalView that tracks personal assets and automatically send bank transactions into Goolgle Sheets

House Price Trends

If you want to share some feedback, please contact us via our facebook group. Version in Dutch language.